


Carvana (NYSE: CVNA) is a site for buying and selling cars. The company has no P/E, it’s unprofitable. But it seems to be promising.
What they make money on
It is an online marketplace for buying and selling used cars. In essence, it is an online car dealer where the customer can buy, sell or exchange a car and then pick it up at one of the delivery centers or have it delivered.
According to the company’s annual report, its revenue is divided into the following segments:
- Sales of used cars to retail customers.
- Wholesale sales. This segment sells cars that have not passed quality control for sale to retail customers.
- Other. This is the sale of various financial products of the company’s partners such as insurance, service contracts, etc.
There is no information in the report about operations outside the U.S., so we will assume that the company does not operate anywhere but in America.
The company’s financial results by segment in thousands of dollars and units
| 2019 | 2018 | 2017 | |
| Revenue: used cars | 3 420 601 | 1 785 045 | 796 915 |
| Revenue: wholesale | 267 586 | 73 584 | 28 514 |
| Other revenue | 251 709 | 96 838 | 33 441 |
| Total revenue | 3 939 896 | 1 955 467 | 858 870 |
| Gross profit: used cars | 237 855 | 94 319 | 32 806 |
| Gross profit: wholesale sales | 16 850 | 5552 | 1845 |
| Other income | 251 709 | 96 838 | 33 440 |
| Total gross profit | 506 414 | 196 709 | 68 091 |
| Number of markets at the beginning of the period | 85 | 44 | 21 |
| Number of new markets | 61 | 41 | 23 |
| Number of markets at the end of the period | 146 | 85 | 44 |
| Used machinery for sale | 177 549 | 94 108 | 44 252 |
| Wholesale Sales | 39 895 | 15 125 | 6509 |
| Average unit price of a used car | 19 266 | 18 968 | 18 009 |
| Average unit price in wholesale sales | 6707 | 4865 | 4381 |
| Gross profit from the sale of the unit: used cars | 1340 | 1002 | 741 |
| Gross profit per unit in wholesale sales | 422 | 367 | 283 |
| Other gross profit | 1418 | 1029 | 756 |
| Total gross profit per unit | 2852 | 2090 | 1539 |
Difference in the company’s financial results by segment as a percentage compared to the previous period
| 2018—2019 | 2017—2018 | |
| Revenues: used cars | 91,6% | 124,0% |
| Revenue: wholesale | 253,6% | 158,1% |
| Other revenue | 159,9% | 189,6% |
| Total revenue | 101,5% | 127,7% |
| Gross profit: used cars | 152,2% | 187,5% |
| Gross profit: wholesale sales | 203,5% | 200,9% |
| Other income | 159,9% | 186,6% |
| Total gross profit | 157,4% | 188,9% |
| Number of markets at the beginning of the period | 93,2% | 109,5% |
| Number of new markets | 48,8% | 78,3% |
| Number of markets at the end of the period | 71,8% | 93,2% |
| Used machinery for sale | 88,7% | 112,7% |
| Wholesale Sales | 163,8% | 132,4% |
| Average unit price of a used car | 1,6% | 5,3% |
| Average unit price in wholesale sales | 37,9% | 11,0% |
| Gross profit from the sale of a unit of used cars | 33,7% | 35,2% |
| Gross profit per unit in wholesale sales | 15,0% | 29,7% |
| Other gross profit | 37,8% | 36,1% |
| Total gross profit per unit | 36,5% | 35,8% |

Promising and something to look at
The company’s core strengths are about the same as CarGurus’: the U.S. car dealership market is low on digitalization and monstrously competitive, which leads to falling margins.
The noticeable disruption in the traditional way dealerships operate due to the pandemic may lead management to think about serious staff reductions and moving a significant portion of operations online. Moreover, there are a lot of employees in dealerships, and in the current circumstances not all of them are needed if the sales process is shifted online.
But potential consumers have an interest in online sales, and a very serious one at that. Together, all of these trends are good for Carvana: the low-base effect – only about 1% of U.S. auto sales are made online – contributes to the company’s natural sales growth. Maybe even some of the big car dealers will make a deal with Carvana to use the company’s site.
The used car market in the United States
| Number of dealers in the used car market | More than 43,000 |
| Share of the largest dealer | 1,8% |
| Cumulative share of the largest 100 dealers | 8,6% |
Source: Company presentation, slide 6
Number of employees at U.S. auto dealerships
| Number of employees, million people | Average number of employees per company, people | |
| 2013 | 0,99 | 59 |
| 2014 | 1,04 | 63 |
| 2015 | 1,08 | 66 |
| 2016 | 1,12 | 69 |
| 2017 | 1,13 | 70 |
| 2018 | 1,14 | 68 |
| 2019 | 1,14 | 70 |
Distribution of employees of car dealerships by occupation
| Managers | 35,7% |
| Technical experts | 24,2% |
| Service | 23% |
| Sellers | 20,6% |
Source: National Automobile Dealers Association report, p. 16 (17)
Attitudes toward buying a car online in the U.S. as the pandemic begins
| April 2020 | June 2020 | November 2020 | |
| I wasn’t going to buy it before the pandemic and I’m not going to buy it now. | 39% | 40% | 40% |
| Wasn’t going to buy before the pandemic, but changed my mind | 29% | 30% | 26% |
| I was going to buy it before the pandemic, and I want to buy it now | 23% | 22% | 27% |
| Interest in buying online has increased | 9% | 7% | 8% |
| Going to buy a car online | 61% | 60% | 60% |
Source: CarGurus study, p. 10
Relative attractiveness
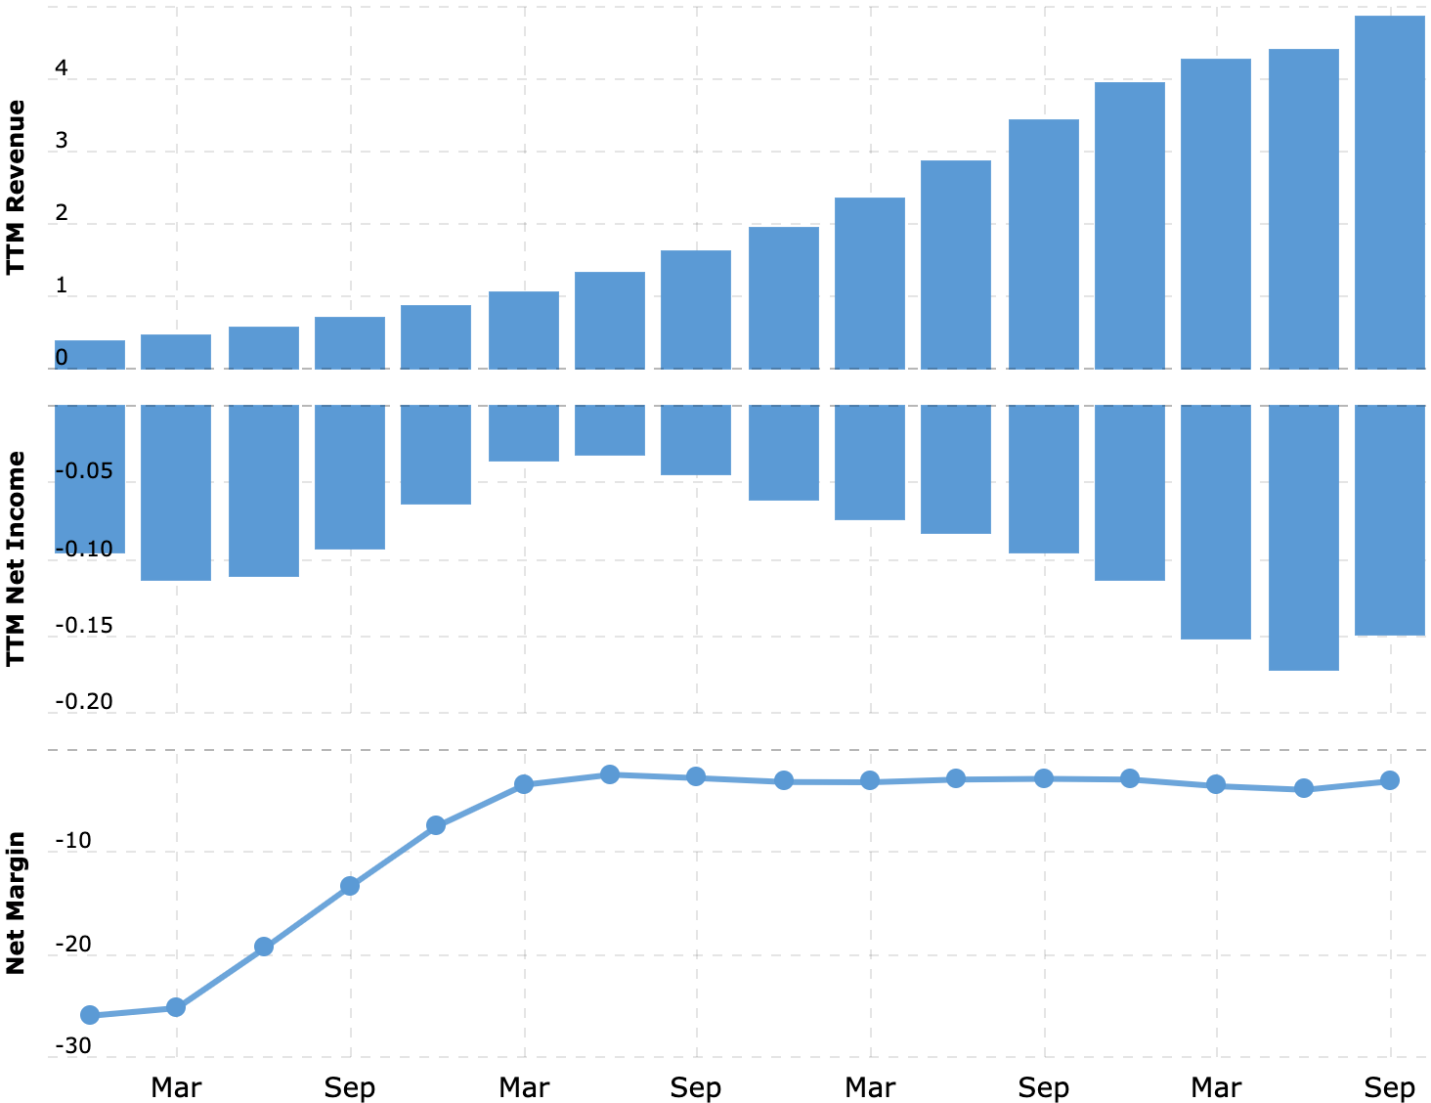
This year, the company’s revenue has increased due to the growth in demand for online car sales. Given the digitalization trends in this area, we can expect growth to continue.
The company’s marketing department is adept at presenting numerous meaningless metrics that are designed to replace the lack of real successes: “in how many regions the company is now available to consumers,” “how the average price of machines purchased at the company website is growing,” even how many vending centers the company has and other information that in no way answers the question “When will your business start bringing in money?”
Financial result of the company by segments for three months by year and percentage difference
| 1 Jan – 30 Sep 2020 | 1 Jan – 30 Sep 2019 | Percentage difference | |
| Revenues: used cars | 1 289 128 | 931 061 | 38,5% |
| Revenue: wholesale | 129 925 | 92 430 | 40,6% |
| Other revenue | 124 556 | 71 408 | 74,4% |
| Total revenue | 1 543 609 | 1 094 854 | 41,0% |
| Gross profit: used cars | 119 607 | 60 563 | 97,5% |
| Gross profit: wholesale sales | 17 110 | 5572 | 207,1% |
| Other income | 124 556 | 71 408 | 74,4% |
| Total gross profit | 261 273 | 137 543 | 90,0% |
| Number of markets at the beginning of the period | 261 | 137 | 90,5% |
| Number of new markets | – — | 9 | −100% |
| Number of markets at the end of the period | 261 | 146 | 78,8% |
| Used machinery for sale | 64 414 | 46 413 | 38,8% |
| Wholesale Sales | 15 375 | 11 698 | 31,4% |
| Average unit price: used cars | 20 013 | 20 059 | −0,2% |
| Average unit price: wholesale | 8450 | 7901 | 6,9% |
| Gross profit from the sale of a unit of used cars | 1857 | 1305 | 42,3% |
| Gross profit per unit in wholesale sales | 1113 | 476 | 133,8% |
| Other gross profit | 1934 | 1539 | 25,7% |
| Total gross profit per unit | 4056 | 2963 | 36,9% |
Financial result of the company by segments for the nine months by year and the difference in percentage
| 1 Jan – 30 Sep 2020 | 1 Jan – 30 Sep 2019 | Percentage difference | |
| Revenues: used cars | 3 245 209 | 2 470 630 | 31,4% |
| Revenue: wholesale | 258 965 | 188 474 | 37,4% |
| Other revenue | 255 985 | 177 205 | 44,5% |
| Total revenue | 3 760 159 | 2 836 309 | 32,6% |
| Gross profit: used cars | 268 035 | 171 063 | 56,7% |
| Gross profit: wholesale sales | 25 881 | 15 600 | 65,9% |
| Other income | 255 985 | 177 205 | 44,5% |
| Total gross profit | 549 901 | 363 868 | 51,1% |
| Number of markets at the beginning of the period | 146 | 85 | 71,8% |
| Number of new markets | 115 | 61 | 88,5% |
| Number of markets at the end of the period | 261 | 146 | 78,8% |
| Used machinery for sale | 171 939 | 127 179 | 35,2% |
| Wholesale Sales | 33 406 | 29 155 | 14,6% |
| Average unit price: used cars | 18 874 | 19 426 | −2,8% |
| Average unit price: wholesale | 7752 | 6465 | 19,9% |
| Gross profit from the sale of the unit: used cars | 1559 | 1345 | 15,9% |
| Gross profit per unit in wholesale sales | 775 | 535 | 44,9% |
| Other gross profit | 1489 | 1393 | 6,9% |
| Total gross profit per unit | 3198 | 2861 | 11,8% |
Source: Company Quarterly Report, pp. 45 (48)
Company growth metrics
| Number of regional markets | Number of units sold | Gross profit in dollars per unit | |
| 2015 | 9 | 6523 | 206 |
| 2016 | 21 | 18 761 | 1023 |
| 2017 | 44 | 44 252 | 1539 |
| 2018 | 85 | 94 108 | 2090 |
| 2019 | 146 | 177 549 | 2852 |
| Q1 2020 | 161 | 52 427 | 2640 |
| 2nd quarter of 2020 | 261 | 55 098 | 2726 |
| Q3 2020 | 261 | 64 414 | 4056 |
EBITDA margin as a percentage of revenue
| 2015 | −25,0% |
| 2016 | −23,2% |
| 2017 | −16,9% |
| 2018 | −10,5% |
| 2019 | −6,2% |
| Q1 2020 | −12,6% |
| 2nd quarter of 2020 | −6,2% |
| Q3 2020 | 1,4% |
Number of vending centers of the company
| 2015 | 1 |
| 2016 | 2 |
| 2017 | 7 |
| 2018 | 15 |
| 2019 | 23 |
| Q1 2020 | 24 |
| 2nd quarter of 2020 | 24 |
| Q3 2020 | 25 |
Source: Company presentation, slide 4
Race
One of the unpleasant features of online commerce is the enormous cost of logistics. About 73.2% of the U.S. population is in its service area. If you compare Carvana’s map of operations with that of its competitors from Vroom, it is clear that Carvana will continue to spend to expand its presence in different regions. To remain the leader and take market share as much as possible, it will take a lot of money, and that will get in the way of profitability.
But even without the expense of expansion, Carvana’s high-margin business seems to me almost impossible. Anything that involves online commerce has low margins and very often leads to heavy losses. Even Amazon doesn’t make most of its profits on online commerce. And practice shows that most companies do not even reach Amazon’s level: their delivery remains unprofitable for long, long years.
It is possible that the company will splurge on the purchase of Vroom, which will add debts of at least $6 billion to its $1.77 billion debt. There is a possibility that the purchase will be financed only in part by loans, and the rest will be obtained through the issuance of new shares. And it is not known how the market may react to it.
Given that the company is unprofitable and expensive, the shares could fall. On the other hand, in 2020, many companies issued additional shares and were not paid anything for it.


Expensive and incomprehensible
In addition to the problems with the expansion of Carvana, there are difficulties with the adequate valuation of the company. It is clear that its market is promising, but it does not justify the capitalization of 50 billion dollars. The company could easily go down in price 5 times from the current price level. The worst thing is that at current prices, it is hard to find a buyer, because nobody wants to pay that much for a loss-making company. CarGurus is only worth a few billion and is already breaking even, so it has better sales prospects than Carvana. Even the loss-making Vroom, with a capitalization of about $5 billion, is much more likely to be bought.
Another problem: A significant share of car sales functions, according to users, should still come from live sales – see the table below. Therefore, the potential capacity of the online car sales market may be lower than many would like to think. In other words, in the future, the company’s revenue may grow worse than investors would like – this could lead to their disappointment and the collapse of quotations.
What steps in the ideal car-buying process Americans would like to see online in 2020
| February | April | June | November | |
| Price negotiation | 25% | 65% | 63% | 61% |
| Auto Finance | 36% | 54% | 55% | 52% |
| Valuation of the machine when exchanging | 34% | 38% | 42% | 41% |
| Buying | 19% | 39% | 37% | 41% |
| Test Drive | 9% | 25% | 18% | 18% |
Source: CarGurus study, p. 10
Summary
On the one hand, it is a promising sector, but on the other hand, it has a prohibitive, inadequate price. What will outweigh it in the end is unclear. But even now, one can invest in these stocks in the hope that Carvana’s quotes will continue to rise thanks to an influx of unscrupulous investors. However, there could be more stocks than unscrupulous investors – then there’s a very good chance that Carvana stock will fly off into the abyss during the market-wide correction.
So investing in Carvana now is like taking bitcoin. You never know what’s going to happen next: growth or decline. And bankruptcy for a loss-making company is always a more than likely prospect.